secure the border, lower taxes, increase productivity,Tariff's ---this 4 part plan will create 2 billion NEW middle class jobs world wide.
increased productivity, are the disruptive technologies, getting introduced into the market.
tariff's are two fold, they are collected like taxes, so they lend support to social programs, but they also help protect certain sectors and jobs from competition (fair or unfair).
secure border---the number of people that do not understand this, is simply incredible to me....
lets say the pie is given to a million people---now let in 1 million people---now you get half the pie, (wages), you were getting before, they (evil) let in the 3rd world invasion...
lower taxes---means gov't will get out of your way, because it's downsizing...
Thursday, July 19, 2018
Thursday, June 21, 2018
Bitcoin Longevity. How long will it dominate!
St. Louis branch of the Federal Reserve has been surprisingly open to cryptocurrency, both as a technology and an asset class.
envisions a future in which cryptocurrencies play an important role.
the true value of bitcoin is $1,800, a figure that roughly correlates to the cost of mining one bitcoin...which is similar to gold pricing--but Bitcoin is a network, like FB or TWTR, (who sell data mining)---but each bitcoin has an unbelievable amount of data to mine.(priceless)!
and with bitcoin cash BCH (the retail fork of Bitcoin),, the feds can order the miners, to add 2% to the number of BCH tokens, thus maintaining its 2% inflation targets! perfecto!
Wednesday, May 23, 2018
bitcoin Tax Tool
Tax Rate
The rate you pay in taxes is determined by two factors:- How long you held the coins
- Your ordinary tax rate
https://bitcoin.tax/faq
- Binance
- Bitfinex
- bitFlyer
- Bitstamp
- Bittrex
- CampBX
- CEX.IO
- Circle
- Coinbase
- Cryptopia
- Gemini
- GDAX
- HitBTC
- Kraken
- KuCoin
- LocalBitcoins
- Paxful
- Poloniex
- VirWox
- Wex (BTC-e)
Tuesday, May 15, 2018
Max Keiser--(virtual currency patent holder) u
Max Keiser--(virtual currency patent holder) update
basic recap---china was unable to shut down its bitcoin people---(huge news), past 6 months.
and work arounds, flourished---so, next step is to replace (the point of failure, exchanges) with peer to peer, websites...
so, (o1o1 steemit username), when bitcoin reaches $180k, that will be 3 trillion market cap, or the entire retail sales, for the EU---
after that happenss, the gov't the gov't may want to freeze bitcoin, or force the admins to print more bitcoin, so that the central banks, can get their 2% cut, under the inflation umbrella---
so as long as bitcoin, increases the volume 2% per year, bitcoin will be allowed to expand from retail customers, to bank customers. as near as I can figure.
Monday, May 14, 2018
the beatles, remix
This a song about the federal reserve
and their 1000 year plan, to devalue the dollar
WRITen, more than 50 years ago, and still packs a stadium, when Paul goes on tour---
my first reaction, after seargent Peppers, was" these guys will be played by others. 400 years from now---too bad star trek, didn't use a beatles song in one of their episodes----
Saturday, May 12, 2018
Monday, May 07, 2018
bitcoin...
bitcoin---
Trade whaT's in front of you---
news that the futures market would add validity to bitcoin, bitcoin reacted with a $19k high---
bitcoin market share, compared to the other crypto and ICO---still maintaining 40+%....
india is doing its own share of regulations, which will bring banking (bitcoin) to a billion folks, that otherwise, have no access to banking.
Wednesday, April 18, 2018
SPY forecast for APRIL...MAY will be even HIGHER!
SPY forecast for APRIL...MAY will be even HIGHER!
GANG BUSTER, HISTORY MAKING Q1 earnings, right now!!!!

GANG BUSTER, HISTORY MAKING Q1 earnings, right now!!!!

Saturday, April 07, 2018
california elitist getting sued for disobeying federal law.
Texas, Arizona announce troop deployments to Mexico border
“The Texas national guard is preparing to immediately deploy with supporting aircraft, vehicles and equipment to the Texas-Mexico border.”
“This deployment has begun with the movement of equipment and troops today. Within 72 hours the Texas military department will have 250 personnel along with ground surveillance vehicles as well as light and medium aviation platforms,” she added.
https://www.infowars.com/texas-arizona-announce-troop-deployments-to-mexico-border/
=-===-===-
Wilcox: ‘We’re Filing 2 Briefs’ Joining Federal Lawsuit Against California’s ‘Sanctuary State’ Laws
I’m happy to report that there actually exist California elected officials who care about the safety and security of their constituents. … There are several cities, elected officials, even a U.S. representative joining our brief that we’re going to file tomorrow evening.”
https://www.infowars.com/
http://www.breitbart.com/radio/2018/04/06/exclusive-dale-wilcox-were-filing-two-briefs-supporting-federal-lawsuit-against/
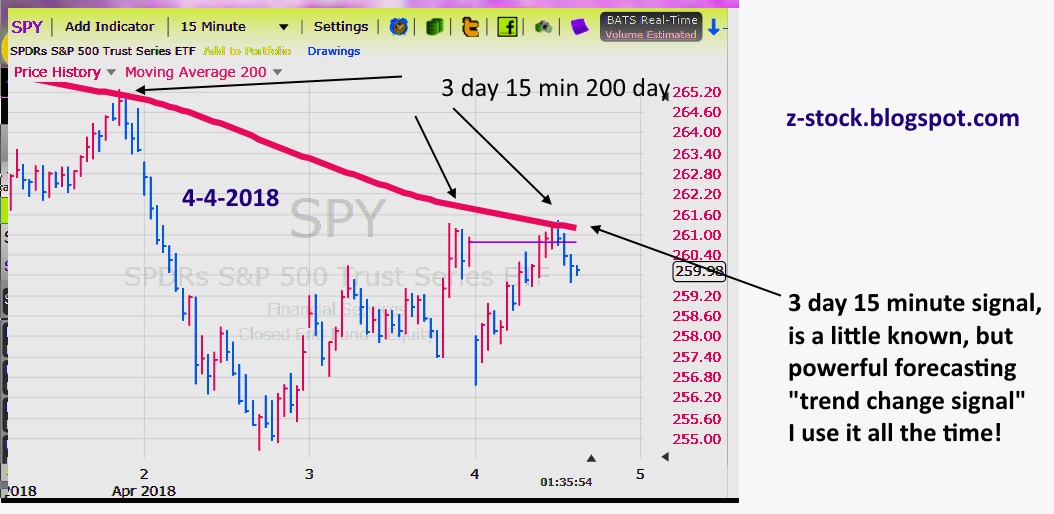
Wednesday, April 04, 2018
SPY update 4-4
15 minute 3 day, 200 moving average
you short the 200 day, and luckily, you can
make your stop, right above the 200 day---
and if you are stopped out
you should look for SPY
TO MOVE 1 to 2% above the its 200 moving average

you short the 200 day, and luckily, you can
make your stop, right above the 200 day---
and if you are stopped out
you should look for SPY
TO MOVE 1 to 2% above the its 200 moving average
Subscribe to:
Posts (Atom)
EMAIL ME !!! anytime
